Monitoring
In this section, we will learn how to use the ash.avalanche.install_monitoring_stack playbook to deploy a monitoring stack for Avalanche nodes and Subnets.
The monitoring stack is comprised of:
For this tutorial, we will use the local inventory provided by the Ansible Avalanche Getting Started repository. See Create a Local Test Network for details.
Always make sure you have the latest version of the collection installed. See Installation and upgrade.
Requirements
The ash.avalanche.install_monitoring_stack playbook installs Prometheus and Grafana through the prometheus.prometheus collection and the cloudalchemy.grafana role.
We can make these available locally with:
ansible-galaxy install -r ansible_collections/ash/avalanche/requirements.yml
Install the monitoring stack
Grafana will be installed on the nodes of the grafana Ansible group and Prometheus on the prometheus Ansible group. In Ansible Avalanche Getting Started, it is the frontend node by default. You can change this by editing the hosts file.
Prometheus Node Exporter will be installed on all nodes in the avalanche_nodes Ansible group.
ansible-playbook ash.avalanche.install_monitoring_stack -i inventories/local
Grafana
Generate the Grafana URL and open it in your browser:
echo "http://$(terraform -chdir=terraform/multipass output -raw frontend_ip):3000"
http://10.117.207.108:3000
The default admin credentials to log in Grafana in the local inventory provided by Ansible Avalanche Getting Started are admin:admin123. You can change it in grafana.yml.
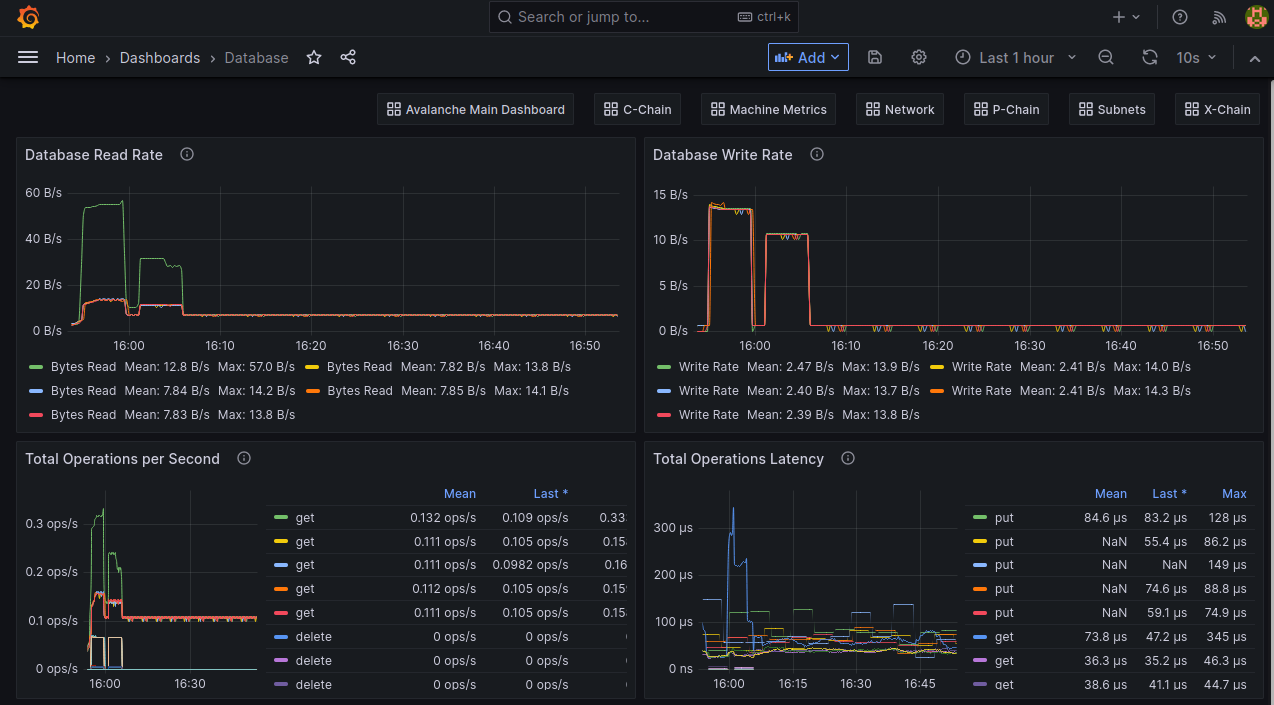
Nodes dashboards
In the local inventory, Grafana is configured to connect with the Prometheus instance and comes with pre-built dashboards (see grafana.yml). The list of available dashboards can be found in the dashboards directory.
Subnet dashboard
If you created Subnet EVM blockchains in the Subnet Creation tutorial, you can configure the Grafana role to install a pre-configured dashboard for them.
To do so, define the grafana_subnets_dashboard_variables variable (in grafana.yml for the local inventory):
grafana_subnets_dashboard_variables:
  - text: Subnet EVM
    value: 2dEmExGjJT6MouJRr1PqV4PSQEbScDAjKuPtT6pgqYR5xdUuac
    selected: true
Then rerun the install_monitoring_stack playbook:
ansible-playbook ash.avalanche.install_monitoring_stack -i inventories/local
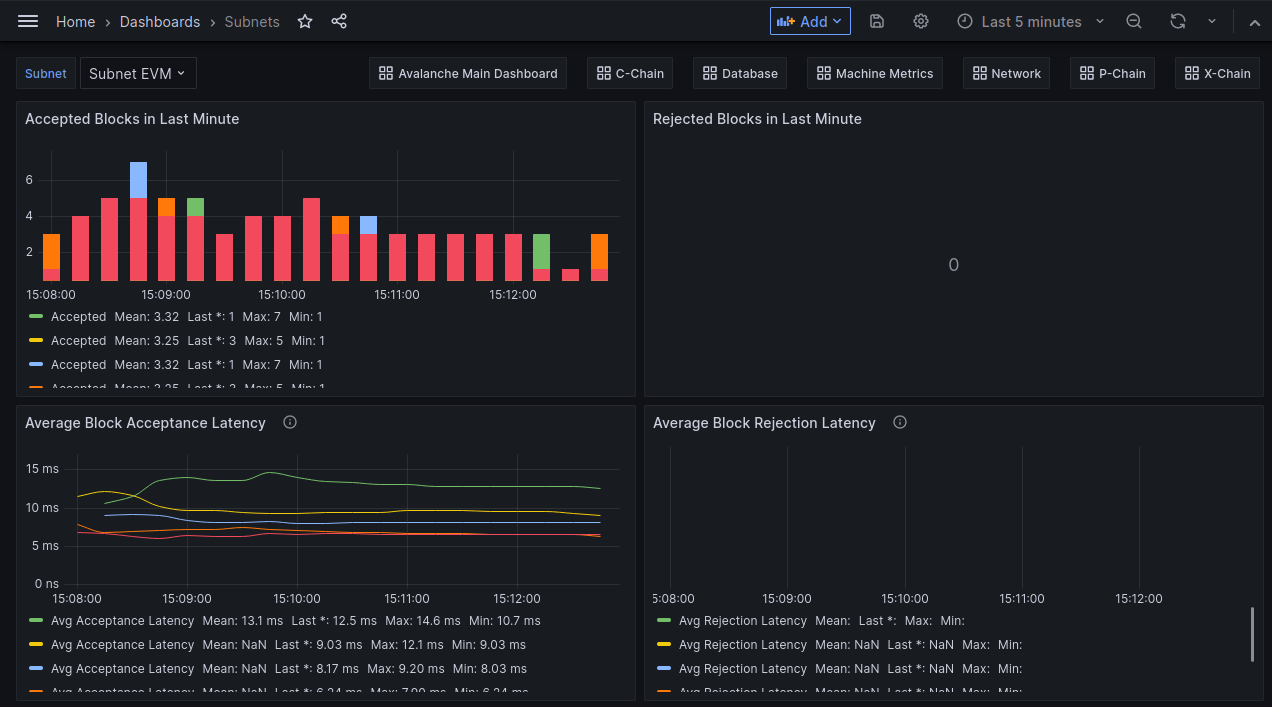
If you deployed multiple Subnet EVM blockchains, you can define them all in the grafana_subnets_dashboard_variables variable, Grafana will display a dropdown menu to select the blockchain to display.
Prometheus
Generate the Prometheus URL and open it in your browser:
echo "http://$(terraform -chdir=terraform/multipass output -raw frontend_ip):9090"
http://10.117.207.108:9090
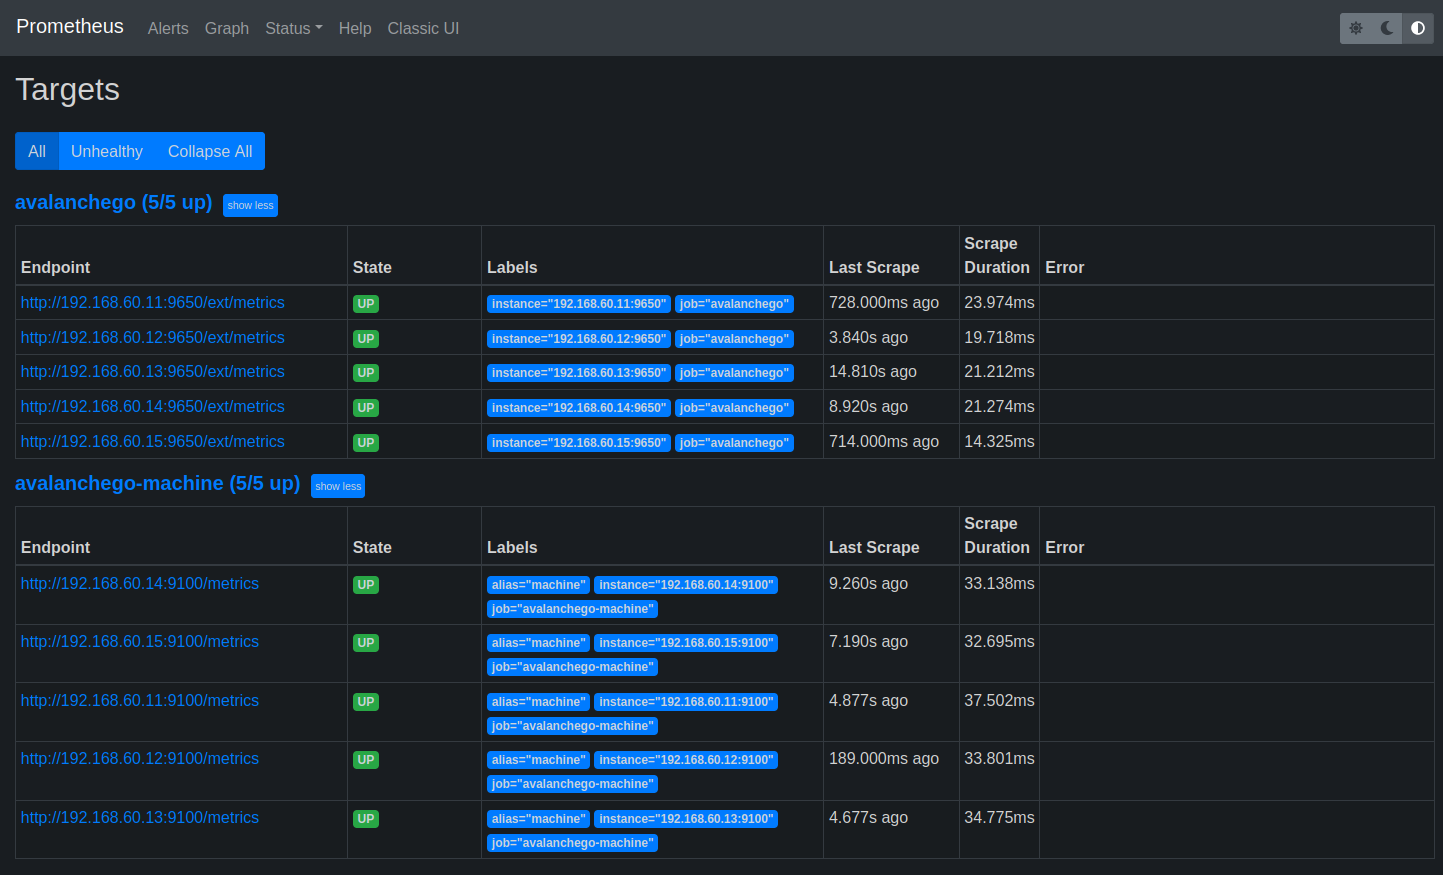
Targets
In the local inventory, Prometheus is configured (see prometheus.yml) to scrape metrics from the Avalanche nodes (endpoint /ext/metrics on port 9650 of AvalancheGo, see documentation for details) and the Prometheus Node Exporter (port 9100 by default).
The ash.avalanche.faucet role is not yet compatible with secured HTTP API endpoints.